Continuous Data Gives Financial Market Analysts the Competitive Edge
A continuous stream of hyperlocal data helps you identify investment opportunities and mitigate risk in time-sensitive situations.

Bring Hyperlocal Insights to Global Market Decisions
Global market analysts rely on up-to-date information to make swift and smart investment decisions and predictions about geopolitical risk, high-volume trades and emerging markets. This data can be hard to access in certain regions of the world. Talisman fills the void with high-quality data that reveals what people in strategic markets are saying and doing.
Continuous Data Your Way
We give you options—ingest our continuous data stream directly into your existing models or view curated insights on the Talisman Dashboard.
Hyperlocal Lens
Talisman gives you a rare, inside look at a local community’s attitudes and actions, which helps you spot emerging trends, economic shifts, policy impacts and more.
Unique, Reliable Sources
Our expert-curated data sources give you visibility into hard-to-access information environments, helping you identify reliable trading signals.
Understand the Global Financial Outlook
Talisman data provides financial analysts with location-specific perspectives on global issues and events so they can anticipate market shifts and make judgments that protect or expand investments. Discover how Talisman can enhance your financial analysis, from tracking commodity supply chain disruptions or evaluating the effects of economic policies on market sentiment to assessing the impact of regulatory changes and geopolitical events.

Peer behind the curtain of Middle Eastern energy markets
Emerging markets analysts have their eye on resource-rich countries like Saudi Arabia and Qatar, yet those are countries with restricted access to information. FilterLabs works with subject matter experts familiar with the region to locate reliable and relevant data sources, giving analysts additional avenues to gather valuable intelligence about local regulations related to energy production and consumption, regional conflicts that may impede oil and gas production or transportation, and more.

Predict fluctuations in clean-energy commodities
Talisman provides the lens into valuable but hard-to-access markets, like China, that supply the minerals and metals necessary for modern energy sources such as wind and solar power. It supplies a constant stream of fused conversational and behavioral data that helps you better understand complex supply chains, government policy and mining activity from the perspective of local communities where those commodities are sourced.

Anticipate market-upending disruptions
Talisman gives you an early, accurate read on geopolitical unrest that might trigger seismic shifts in financial markets. By collecting and analyzing hyperlocal data and providing it as a continual data stream, Talisman alerts you when a region is under turmoil due to factors like labor strikes, political protests, border closings, election disputes and more—long before Western media reports on the problem.

Follow consumer trends in developing economies
Talisman gathers data from consumer conversations and behavior to help you spot trends in economies where disposable income is on the rise. For instance, you can see what products are generating “buzz” in a local community of China, India, Qatar or Saudi Arabia, or learn what technology and equipment is gaining traction in lesser-known but potentially lucrative markets like Bahrain and Oman.

Spot opportunities during post-conflict recovery
Talisman collects and analyzes local economic indicators such as employment rates, business openings and consumer spending patterns in post-conflict zones like Syria or Yemen. This data helps financial analysts identify investment opportunities in rebounding sectors long before their competitors do.

Data When and How You Need It
Raw Data Stream for In-House Analysis
Connecting to our API allows you to seamlessly feed Talisman data directly into your existing analytic models. This complements your existing data sources and workflow with unique, hyperlocal intelligence to deepen your understanding of market-critical situations.
Query-Specific Content
Receive information most relevant to what you’re watching in regions of interest or investment focuses.
Continuous Refresh
Always have the most recent, localized data on hand to ensure smart and timely decision-making.
Precise Filtering
Narrow your search by date, location, topic or region to pinpoint exactly the information you need.

Thought Leadership

Insights Report
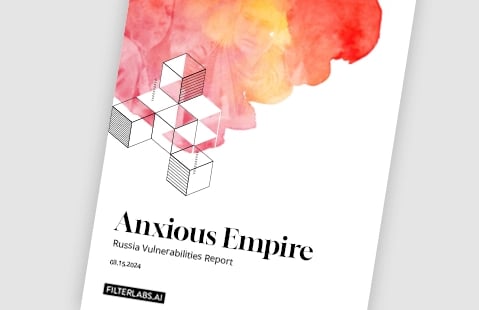
Anxious Empire: Russia Vulnerabilities Report

FilterLabs in the News
Iran pushes a propaganda campaign to Arab nations. Not everyone is impressed.

FilterLabs in the News
AI for Peace: What is the Russian public thinking?
Better Data, Better Decisions
Schedule a demo to see how a steady supply of localized data can give you a strategic edge in global investing.

%20-%20Tradmark.png)